Your Product Data Can Be Sexy
 Let’s face it, data is dry, yet it’s these very facts that can make a visitor become a believer. But how do you interest the visitor long enough to convert them? You need sexy data.
Although product data won’t make your girlfriend love you, it can be transformed into an attractive package that piques interest. We’re talking about charts. The kind with pretty colors and simple-to-grasp concepts. Visitors can understand in a few seconds what would take half a minute to read, and those precious seconds can make all the difference.
Let’s say you sold weight loss supplements. You could spend an entire paragraph talking about how much your product augments one’s weight loss routine. Or you could display a chart like the one above. Even those who don’t care about supplements will likely pause and glance at the chart. That is the power of pictures.
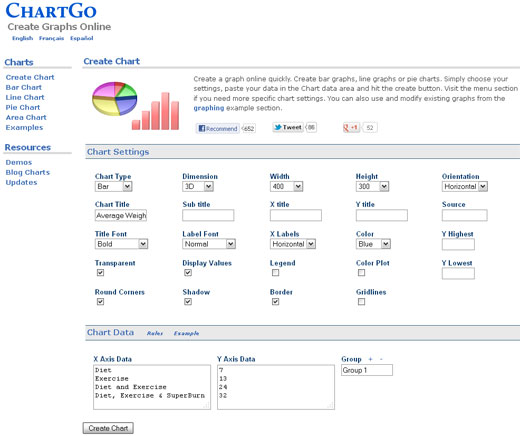
If you are an Excel wizard, you can use it to create various of charts and graphs. If you’re not, there’s still hope. There are various online services that will create a chart out of your data for you. One of the easiest (and free!) we found is called ChartGo. The screenshot below shows all the data entered to create the chart above. Simply choose what kind of chart you want, enter a title, and plug in your numbers. Bam, instant chart. You may need to fiddle around with the settings to get it just the way you want it, but the chart creation is so fast that you won’t find it to be a chore.
The next time you find yourself using a lot of words to describe a product, think about adding a diagram or chart to quickly drive your points. There are numerous tools to help you. Other free online chart building websites include:

